| Name | Date |
| GEO1OO Globalization Exercise | Dr. Rodrick A. Hay, Fall, 2004 |
| Due: November 2,2004 | 20 points |
MAPPING YOUR CLOTHES
This exercise is intended to give you an idea of where your cloths are made. The exercise has three parts.
Part 1. Keep a record of all the clothes you wear for seven days (at least 30 items). Each item should be listed by type of clothing, (footwear, socks, blouse, pants, skirt/dress, watch, belt, coat, hat, etc.), and place of manufacture. Number each item and DO NOT list items twice (if you wear the same coat every day, only record it once).
Your list should look like this:
|
China Mexico |
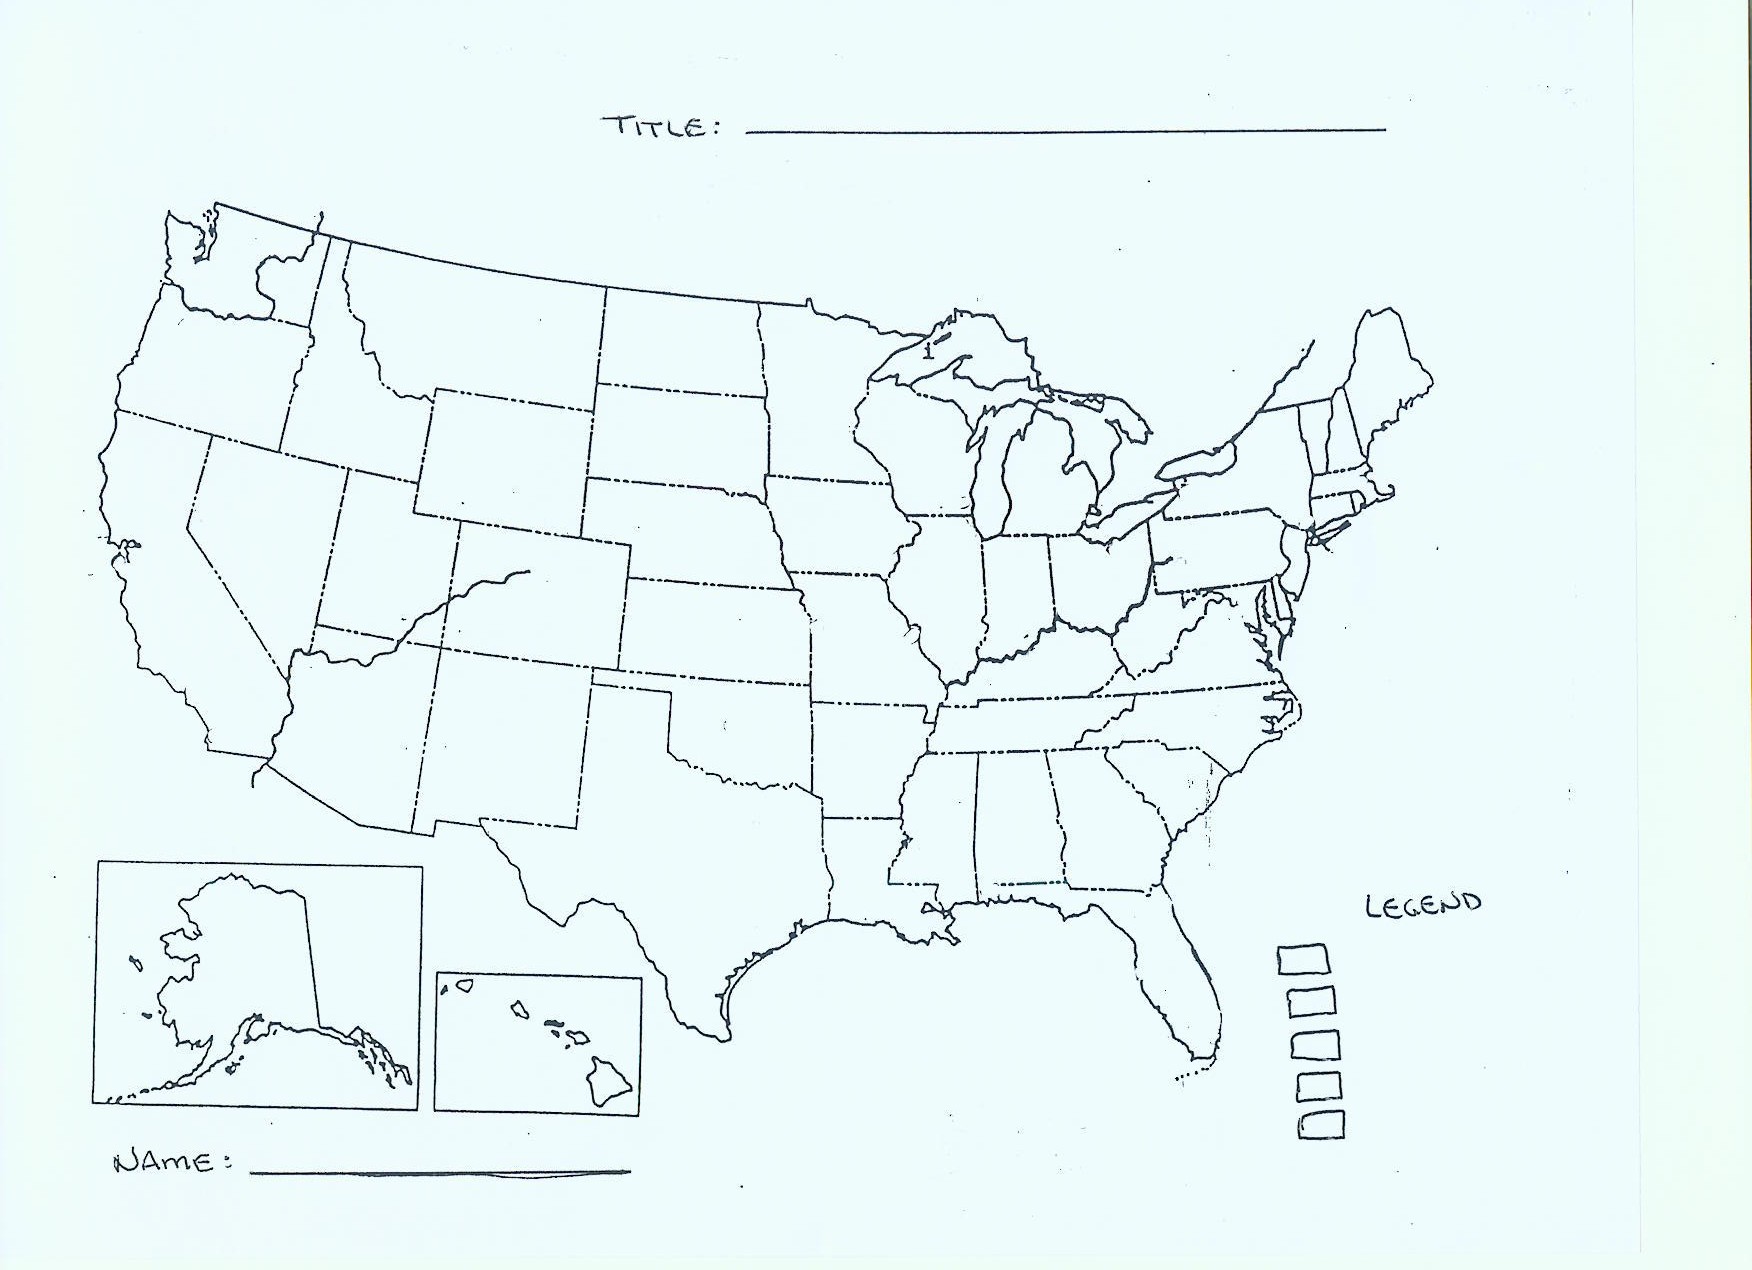
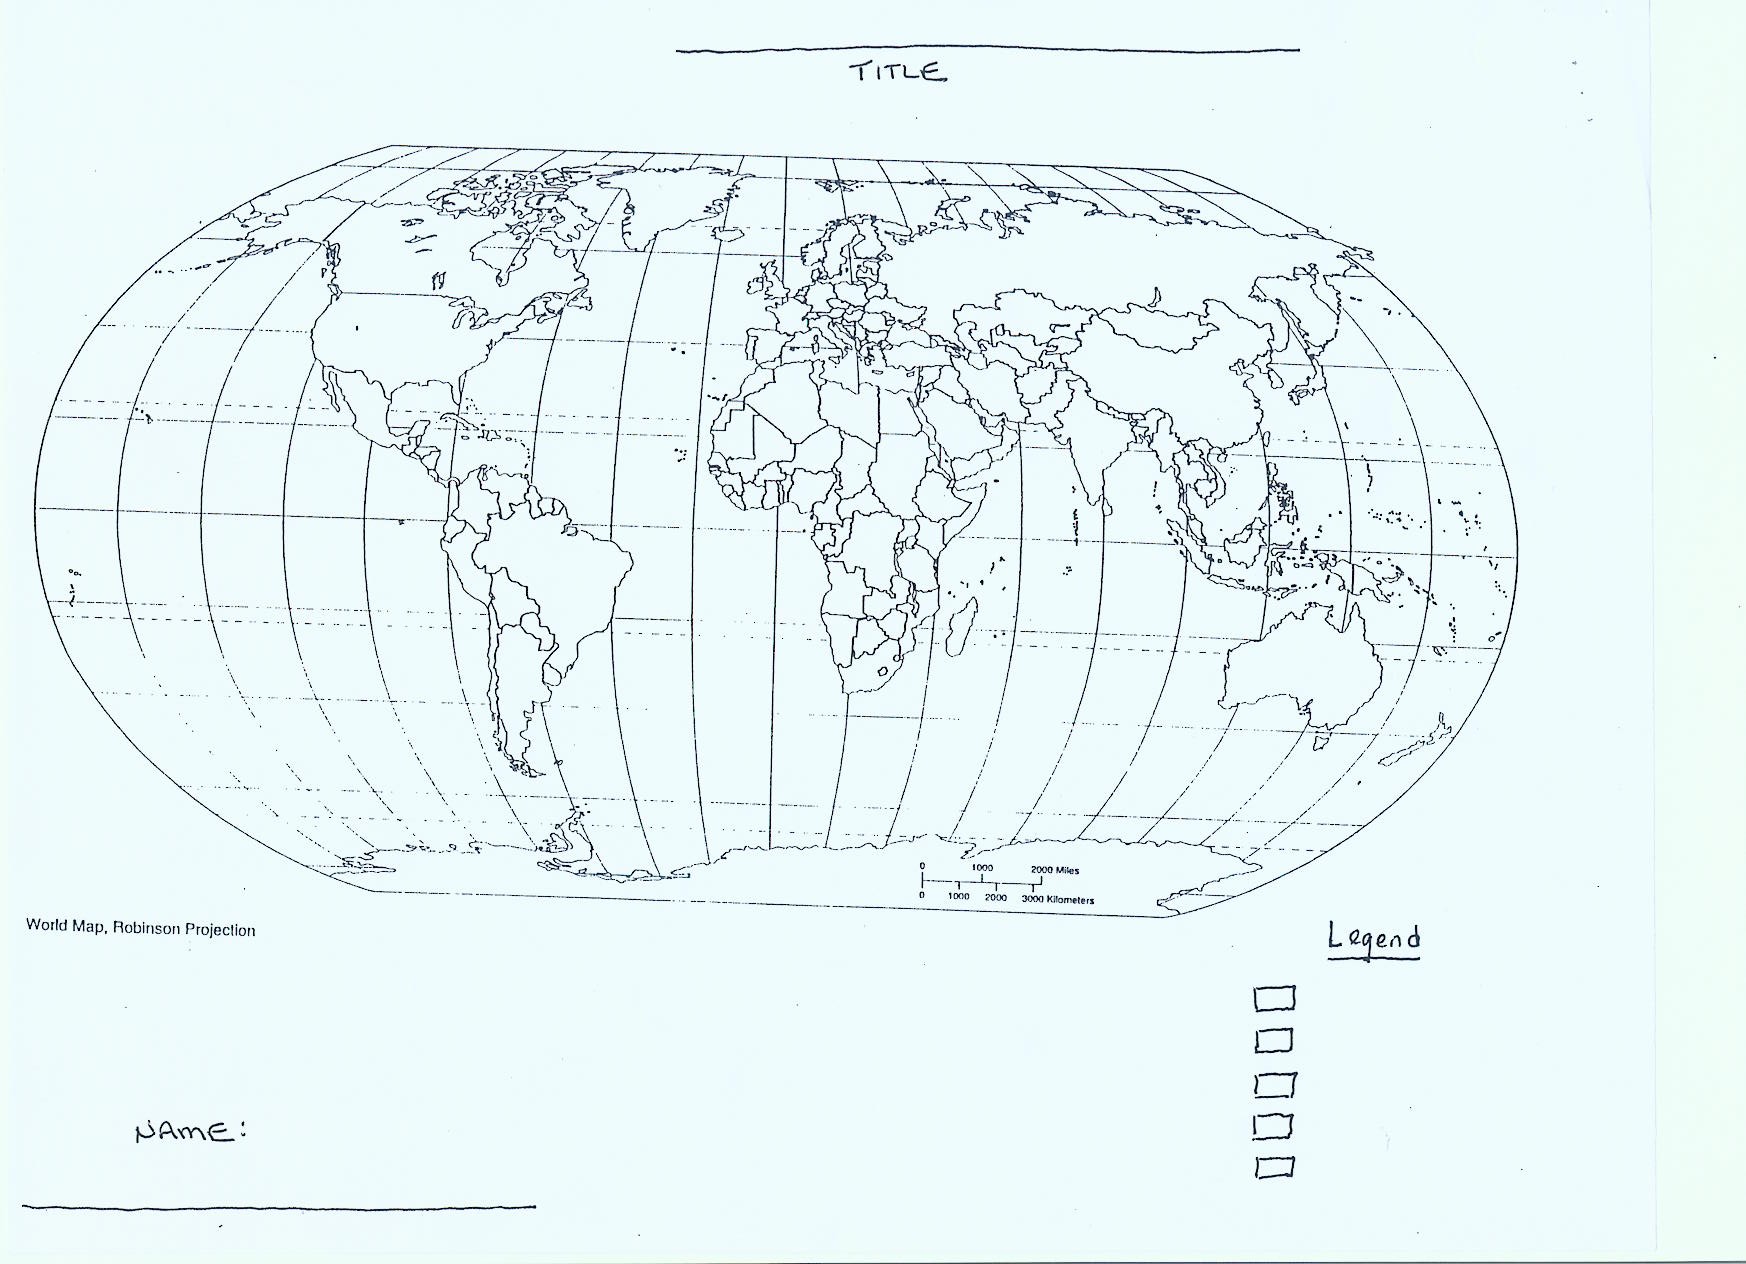
Part 2. After you have completed your list, use a map of the United States and one of the world to create a cholopleth map of where your clothes are made. A choropleth map is one on which different colors are assigned to different areas (countries) based on how many items are manufactured there.
Choropleth Map:| a. | Create a legend. There should be five total categories (or data ranges). Assign a color to each data range including white (blank) for zero. Use different colors for the different ranges in values. For example: Use blue for the range with the highest values, green for the range with the next highest values, yellow for the range with the next highest values, and red for the range with the lowest values (except for zero). Leave all countries white (blank) if no items came from those countries. Sample ranges may be: 0, 1-2,3-4, 5-6, and 7+. |
| b. | Color in your map with the colors you assigned to the different ranges. MOST OF YOUR MAP WILL REMAIN WHITE. |
| c. | Add a title |
Part 3. IMPORTANT! Look at your maps. What can you say in general about the distribution of clothes you wear? Do some items, shirts, pants, come from specific areas or regions? Why is this so? What is the map telling you?